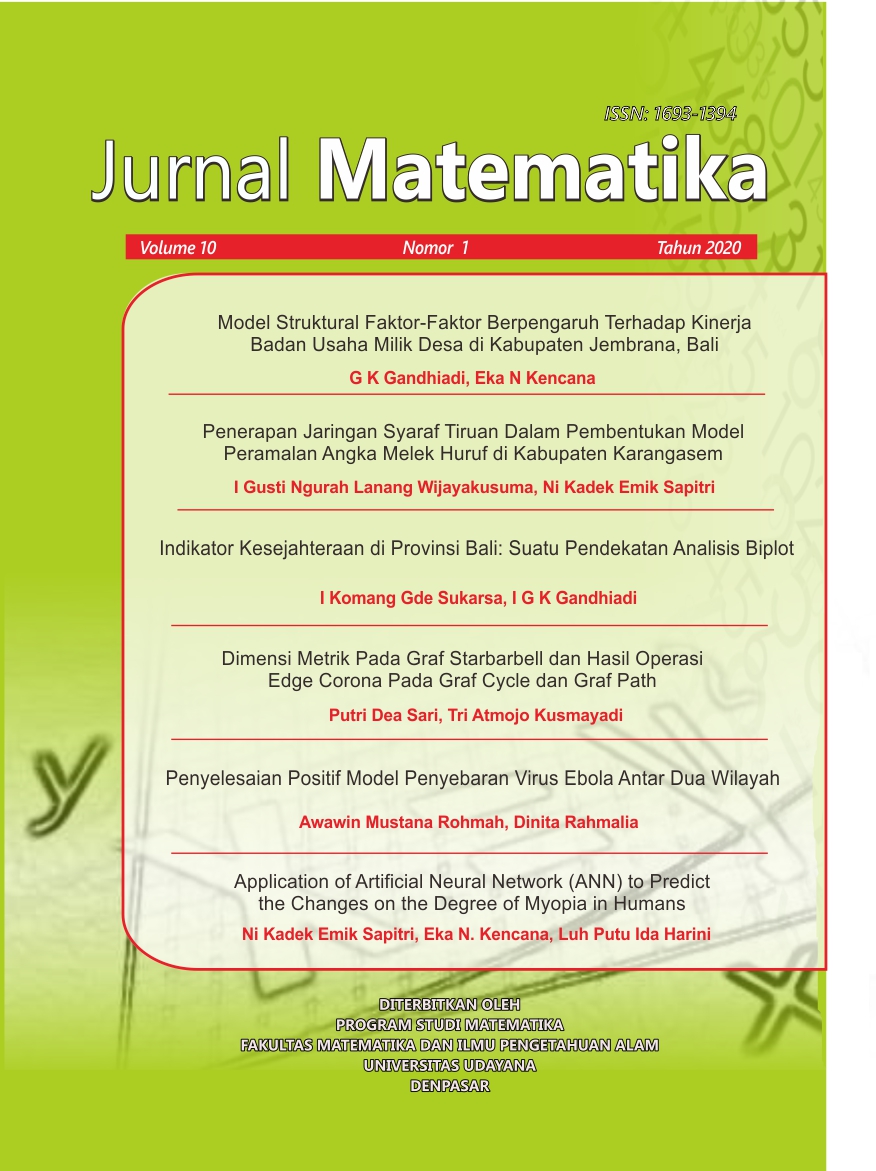
Indikator Kesejahteraan di Provinsi Bali: Suatu Pendekatan Analisis Biplot
Abstract
The goal of this reseach is to get the representation of welfare in Bali province based on the indicators represented by People Development Indexs (PDI). PDI is the indexs is a latent variable that can not be measured like measurement variable, so to measure PDI have to be measure by several indicators. In tgeneral, PDI is measured by three indicators that is a long and Healthy life as the Health Indicators, Education Indicators and decent standard of living as Economic Indicators. In Practice, Health Indicators is measured by mean expectation of life. Mean of long school and expectation of long school are measurement of Education Indicators. Whereas Economic Indicators is represented by purchasing power parity.
In Staistics methods, to represent or analize multivariate variable there are many methods can be used. One of the methods is Biplot. In Biplot analysis we can represent information about row matrix and coloum matrix simultaneous. In this cases we can get information about object ( 9 districs or city in Bali) and Welfare Indicators represented by PDIsimultanous.
The result of biplot analysis in this research is two dimension graphic that represent Euclid distance of object and correlation of indicators so that we can get information of the grouping of object and the characteristic variables of the certain group.
Downloads

Jurnal Matematika (JMAT) is licensed under a Creative Commons Attribution License (CC BY-NC 4.0)


